Introduction
Sieve test analysis is carried out as described in the technical method for highways documents. The barrel and the sieves are stacked upon each other to retain the fractions of the soil. The material retained on each sieve is then weighed and recorded. The percentage value of the retained material in each sieve and are plotted on a graph. The vertical scale shows the percentage of values while the horizontal axis shows the sizes of the sieves.
Sieve analysis is a mechanical test of granular materials performed on samples collected during the standard penetration test. Spoon samples are taken to the lab to provide the percentages of analysis of the granular material by size and weight. The rock information includes its relative hardness and compressive strength. The type of rock is classified by the geologist who provides the quality of the rock in relation to the total length of the core. The hardness of the rock is determined by comparing the rock top ten materials of known hardness. A sieve analysis (or gradation test) is a practice or procedure used to assess the particle size distribution of a granular material.
The size distribution is often of critical importance to the way the material performs in use. A sieve analysis can be performed on any type of non-organic or organic granular materials including sands, crushed rock, clays, granite, feldspars, coal, and soil, a wide range of manufactured powders, grain and seeds, down to a minimum size depending on the exact method. Being such a simple technique of particle sizing, it is probably the most common.
Sieve Analysis
Aims
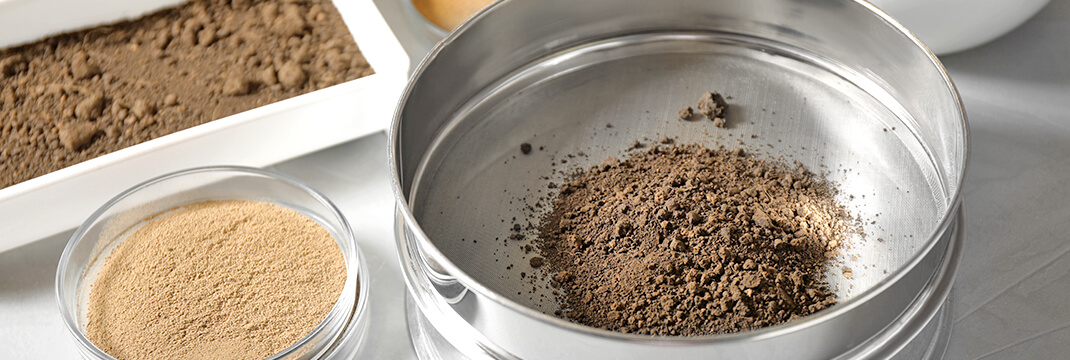
A gradation test is performed on a sample of aggregate in a laboratory. A typical sieve analysis involves a nested column of sieves with wire mesh cloth. A representative weighed sample is poured into the top sieve which has the largest screen openings. Each lower sieve in the column has smaller openings than the one above. At the base is a round pan, called the receiver.
The column is typically placed in a mechanical shaker. The shaker shakes the column, usually for some fixed amount of time. After the shaking is complete the material on each sieve is weighed. The weight of the sample of each sieve is then divided by the total weight to give a percentage retained on each sieve. The size of the average particle on each sieve is then analyzed to get a cut-off point or specific size range, which is then captured on a screen.
Results
The results of this test are used to describe the properties of the aggregate and to see if it is appropriate for various civil engineering purposes such as selecting the appropriate aggregate for concrete mixes and asphalt mixes as well as sizing of water production well screens.
To emphasize on the above, the following example is used. A sample of gravel weighing 3240 grams is oven-dried and then put through a sieve analysis test, the sieve sizes required for the test areca as follows, 26.5mm, 19.0mm,13.2mm,2.0mm,0.425mm and 0.075mm. A pan is needed to retain the soil particles finer than 0.075mm.
In order to determine the amount of soil retained, the sieves are stack on top of each other varying from 37.7mm at the top to 0.075mm at the bottom. The pan is placed below to trap the materials that passe4s the last sieve. The soil on the top sieve is carefully poured out. The stacks are shaken to facilitate the movement of soil particles through various sieves. The results are obtained by weighing each fraction of soil to the nearest 0.1gram and are entered in table 1.1 below. (Errol)
| Sieve size (mm) | Mass of soil retained (%) |
| 37.5 | 0 |
| 26.5 | 1032 |
| 19.0 | 793 |
| 13.2 | 558 |
| 4.75 | 323 |
| 2.0 | 215 |
| 0.425 | 144 |
| 0.075 | 199 |
| Less than 0.075 | 56 |
To calculate the retained mass in the sieve the formula mass of soil retained on sieve/total mass of sample* 100 is used and the results are entered in table 1.2 below.
| Sieve size (mm) | Mass of soil retained | % of soil retained |
| 37.5 | 0 | 0 |
| 26.5 | 1032 | 31.9 |
| 19.0 | 793 | 24.5 |
| 13.2 | 558 | 17.2 |
| 4.75 | 323 | 10.0 |
| 2.0 | 215 | 6.6 |
| 0.425 | 144 | 4.4 |
| 0.075 | 199 | 3.7 |
| Less than 0.075 | 56 | 1.7 |
| Total | 3240 | 100 |
Discussions
Taxonomy deals with the theoretical aspect of rock classification in euphorically approaches and is widely used in civil engineering. When correctly used, the classification of rock masses is a powerful tool in feasibility designs. Most engineers use these approaches on many projects as they serve as the practical basis for the design of complex underground structures. The Gjovik underground ice hockey stadium in Norway serves as an example of a design that used this approach.
Quantitative rock classification systems are objectively used due to a number of benefits. First, it provides better communication between geologists, designers, engineers, and contractors. The observations, experience, and judgments by engineers are correlated and consolidated more effectively by a quantitative rock classification system. Further, engineers prefer numbers in place of description, therefore, the approach has considerable application in an overall assessment of rock quality. In addition, rock classification helps in the organization and flow of knowledge.
In classification systems, the minimum rating is assigned to the poorest rock mass while the maximum rating is credited to the excellent bones. This shows that every parameter of classification plays an important role in the overall rating. Most of these approaches are accurate in both poor and excellent rock conditions. However the reliability decreases for medium rock conditions, it is important to note that there is no single method that is valid in classifying the rock masses that are not disturbed beyond the excavated face. Most importantly, precaution should be taken to avoid double accounting in classification and analysis, joints should not be considered during the classification process if these were accounted for in the analysis.
Additionally, there is a need to account for fuzzy variations of rock parameters approximately after giving allowance for uncertainties. As a precaution measure, it is better to assign a range of ratings for each parameter as experience shows that there is a wide variation in quantitative classification at a location.
You may find this article Buy Classification Essay useful.
Abstract
For engineering purposes, topsoil is generally removed before any engineering projects are commenced, the soil is divided into types according to sizes of individual particles. Broadly, soli consists of soil particles, moisture, and air voids. From the engineering point of view, it is essential to remove voids to better the strength through a compaction process.
The moisture content plays an important role in determining physical properties. In order to get good compaction, it is important to use the correct amount of water. Sieve tests are effectively used to determine the dry strength by following the steps below.
The lump of soil is squeezed into a lump and then is left out in the sun to dry for a few hours, once it dries, fingers are used to apply pressure to the lump in order to crumble it. The process is repeated for different types of soil and at the same time noting the pressure required to crumble each type. It is important to acquire the dry strength this it is necessary to make various mixtures and compare the results.
In order to determine the coarseness of the soil particles, the soil samples are rubbed together between the fingers. Clay soils have a smooth texture, are greasy such that it might stick in the fingers while the silt soils dry quickly and leave only stains on the fingers.
The constituency properly of the soils plays the resistance to flow. It reflects the cohesive abilities and it is affected by the moisture content in the soil. Constituency tests are used to classify and indicate soils with poor plastic properties and estimate the strength of the soil. It is expressed to me three defining limits, that is, liquid limit, plastic limit, and plasticity index. The liquid limit is the moisture content and it is expressed as % by weighing the dry soil at the boundary between plastic and liquid state. It varies between 40-60% for typical clay soils and 25-50% foe silt soils. Due to its granular form, sandy soils have no liquid limit.
On the other hand, the plastic limit is the moisture content of the soil at the boundary between plastic and semi-solid state. It is obtained by rolling a sample between the fingers until a thread of approximately 3mm is achieved, it is also expressed as a % of the dry material. The plastic index is the value used in conjunction with the liquid and plastic limits. It is the difference between the two limits, it is the range of, moisture content over which the soil is in the plastic state. Plasticity index= liquid limit- plastic limit.
Specific gravity is the ratio of the weight of the solid material per unit volume to the weight of an equal volume of water under standard conditions. These are tests used to calculate the density and porosity of materials. A hydrometer is used to determine this value and it is mostly carried out on fine aggregates. The specific gravity of water is 1.0 while most of the coarse aggregates that are used in road construction have values ranging between 2.65 -2.70.
A particle size distribution test is used to identify the soli particles in different shapes and sizes as the soil structure is not homogenous. The sizes refer to the openings in the openings in the sieves. In the case of 63.0mm* 63.0mm, any material larger than this will not pass through the sieve and it will be less fine than classified as rock. Smaller materials less than 0.425mm are the fine aggregate mostly called the clay particles.
Factors such as particle shape may play a role in the deviations of test results for the finer fractions. The total amount of deviations is not high and it probably occurring within the experiment, sample collection, preparation and testing procedures. Additional research is necessary it investigate the factors influencing the deviations from the hydrometer results due to the increased plasticity of soils.
The serigraphs are a rapid and more accurate method of analysis than the hydrometer. While using the serigraphs these are the procedure to be followed. The dry soil which is not necessarily preserved prior to top testing is used. The retained fraction on the number 200 sieve should be dried, weighed and the distribution of particle sizes is calculated. The suspension should be mixed with a high sped mixer during sampling. A two-way valve and the peristaltic pump is used to obtain samples for testing in the serigraph.
Concrete soil classification includes the classification of constituents, the description of appearance and structural characteristics and the determination of compactness. The coarse granule soil has particles finer than 3-inch. The best color that describes the samples is used. When there are more than two distinct colors then a multicolored notation is used. The grain size is used to identify the fractions and the components of the soil. The compactness is estimated by measuring the resistance to penetration of a selected sampling device. If the standard, the penetration test is performed.
The design experience suggests that an average rock mass rating should be considered in the design of the support system. A rigorous classification system may become more reliable in case of uncertain parameters that are dropped and considered indirectly. An easy system approach tries to give a sequence of dominant parameters at the site. These systems must be non-linear to classify rock masses in a more realistic manner. It has been found that the strength parameter decreases non-linearly within rock masses for dry rock.
The empirical, numerical, analytical and observational approaches are various tools for engineering designs, it involves the evolution of the judgmental process over a long period in the field. The empirical approach is based on rock masses and it is popularly used due to its basic purpose of simplicity and ability to manage uncertainties. If there is a sudden change in geology, designers should make instant decisions in supporting measures.
The analytical approach of rock classification is based on uncertainties assumptions and obtaining correct values of input parameters. It has a disadvantage because it is expansive and time-consuming. On the other hand, the observational aspect is based on monitoring the efficiency of the support system.
Conclusion
The rock classification aspects are facing challenges because the validity is affected by damages resulting from blasting and weathering especially in the cold season and under the ocean. Further, the rocks have extraordinary geological occurrence problems that should be sorted under the guidance of national and international experts.
Designers should develop design solutions and design strategies that are robust, that is, they are able to perform well bad adequately even in unknown geological conditions such as shotcrete and reinforced rock arch is an effective strategy. The Norwegian method of tunneling has evolved facilitating its adoption in supporting a wide variety of rock conditions.